Home
Card Category Recommendation
First 5 Rows of the Dataset:
| Attrition_Flag |
Customer_Age |
Gender |
Dependent_count |
Education_Level |
Marital_Status |
Income_Category |
Months_on_book |
Total_Relationship_Count |
Months_Inactive_12_mon |
Contacts_Count_12_mon |
Credit_Limit |
Total_Revolving_Bal |
Avg_Open_To_Buy |
Total_Amt_Chng_Q4_Q1 |
Total_Trans_Amt |
Total_Trans_Ct |
Total_Ct_Chng_Q4_Q1 |
Avg_Utilization_Ratio |
| Existing Customer |
45 |
M |
3 |
High School |
Married |
$60K - $80K |
39 |
5 |
1 |
3 |
12691.0 |
777 |
11914.0 |
1.335 |
1144 |
42 |
1.625 |
0.061 |
| Existing Customer |
49 |
F |
5 |
Graduate |
Single |
Less than $40K |
44 |
6 |
1 |
2 |
8256.0 |
864 |
7392.0 |
1.541 |
1291 |
33 |
3.714 |
0.105 |
| Existing Customer |
51 |
M |
3 |
Graduate |
Married |
$80K - $120K |
36 |
4 |
1 |
0 |
3418.0 |
0 |
3418.0 |
2.594 |
1887 |
20 |
2.333 |
0.0 |
| Existing Customer |
40 |
F |
4 |
High School |
Unknown |
Less than $40K |
34 |
3 |
4 |
1 |
3313.0 |
2517 |
796.0 |
1.405 |
1171 |
20 |
2.333 |
0.76 |
| Existing Customer |
40 |
M |
3 |
Uneducated |
Married |
$60K - $80K |
21 |
5 |
1 |
0 |
4716.0 |
0 |
4716.0 |
2.175 |
816 |
28 |
2.5 |
0.0 |
Table: Rows10127 x Columns19
DataSet Information
Index: 2026 entries, 3781 to 8802
Data columns (total 19 columns):
# Column Non-Null Count Dtype
--- ------ -------------- -----
0 Attrition_Flag 2026 non-null int32
1 Customer_Age 2026 non-null int64
2 Gender 2026 non-null int32
3 Dependent_count 2026 non-null int64
4 Education_Level 2026 non-null int32
5 Marital_Status 2026 non-null int32
6 Income_Category 2026 non-null int32
7 Months_on_book 2026 non-null int64
8 Total_Relationship_Count 2026 non-null int64
9 Months_Inactive_12_mon 2026 non-null int64
10 Contacts_Count_12_mon 2026 non-null int64
11 Credit_Limit 2026 non-null float64
12 Total_Revolving_Bal 2026 non-null int64
13 Avg_Open_To_Buy 2026 non-null float64
14 Total_Amt_Chng_Q4_Q1 2026 non-null float64
15 Total_Trans_Amt 2026 non-null int64
16 Total_Trans_Ct 2026 non-null int64
17 Total_Ct_Chng_Q4_Q1 2026 non-null float64
18 Avg_Utilization_Ratio 2026 non-null float64
dtypes: float64(5), int32(5), int64(9)
memory usage: 277.0 KB
DataSet Description
|
Attrition_Flag |
Customer_Age |
Gender |
Dependent_count |
Education_Level |
Marital_Status |
Income_Category |
Months_on_book |
Total_Relationship_Count |
Months_Inactive_12_mon |
Contacts_Count_12_mon |
Credit_Limit |
Total_Revolving_Bal |
Avg_Open_To_Buy |
Total_Amt_Chng_Q4_Q1 |
Total_Trans_Amt |
Total_Trans_Ct |
Total_Ct_Chng_Q4_Q1 |
Avg_Utilization_Ratio |
| count |
10127.000000 |
10127.000000 |
10127.000000 |
10127.000000 |
10127.000000 |
10127.000000 |
10127.000000 |
10127.000000 |
10127.000000 |
10127.000000 |
10127.000000 |
10127.000000 |
10127.000000 |
10127.000000 |
10127.000000 |
10127.000000 |
10127.000000 |
10127.000000 |
10127.000000 |
| mean |
0.839340 |
46.325960 |
0.470919 |
2.346203 |
3.096574 |
1.463415 |
2.863928 |
35.928409 |
3.812580 |
2.341167 |
2.455317 |
8631.953698 |
1162.814061 |
7469.139637 |
0.759941 |
4404.086304 |
64.858695 |
0.712222 |
0.274894 |
| std |
0.367235 |
8.016814 |
0.499178 |
1.298908 |
1.834812 |
0.737808 |
1.504700 |
7.986416 |
1.554408 |
1.010622 |
1.106225 |
9088.776650 |
814.987335 |
9090.685324 |
0.219207 |
3397.129254 |
23.472570 |
0.238086 |
0.275691 |
| min |
0.000000 |
26.000000 |
0.000000 |
0.000000 |
0.000000 |
0.000000 |
0.000000 |
13.000000 |
1.000000 |
0.000000 |
0.000000 |
1438.300000 |
0.000000 |
3.000000 |
0.000000 |
510.000000 |
10.000000 |
0.000000 |
0.000000 |
| 25% |
1.000000 |
41.000000 |
0.000000 |
1.000000 |
2.000000 |
1.000000 |
2.000000 |
31.000000 |
3.000000 |
2.000000 |
2.000000 |
2555.000000 |
359.000000 |
1324.500000 |
0.631000 |
2155.500000 |
45.000000 |
0.582000 |
0.023000 |
| 50% |
1.000000 |
46.000000 |
0.000000 |
2.000000 |
3.000000 |
1.000000 |
3.000000 |
36.000000 |
4.000000 |
2.000000 |
2.000000 |
4549.000000 |
1276.000000 |
3474.000000 |
0.736000 |
3899.000000 |
67.000000 |
0.702000 |
0.176000 |
| 75% |
1.000000 |
52.000000 |
1.000000 |
3.000000 |
5.000000 |
2.000000 |
4.000000 |
40.000000 |
5.000000 |
3.000000 |
3.000000 |
11067.500000 |
1784.000000 |
9859.000000 |
0.859000 |
4741.000000 |
81.000000 |
0.818000 |
0.503000 |
| max |
1.000000 |
73.000000 |
1.000000 |
5.000000 |
6.000000 |
3.000000 |
5.000000 |
56.000000 |
6.000000 |
6.000000 |
6.000000 |
34516.000000 |
2517.000000 |
34516.000000 |
3.397000 |
18484.000000 |
139.000000 |
3.714000 |
0.999000 |
Correlation Matrix:
Visual representation of the correlation between the columns of the dataset.
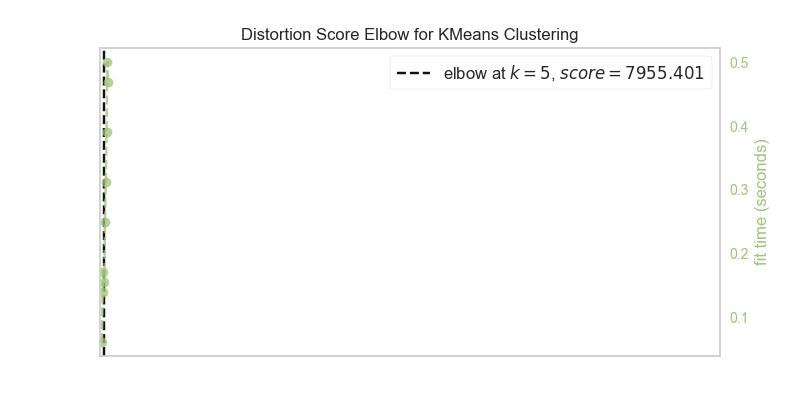
Elbow Graph:
Method to find the optimal number of clusters.
Scatter Plot of Clusters:
Visualization of clusters with their data points.
- Yellow Color Cluster consists of customers with high income and high credit limit -- Diamomd Card_Category
- Pink Color Cluster consists of customers with high income and medium credit limit -- Plantinum Card_Category
- Orange Color Cluster consists of customers with medium income and medium credit limit -- Gold Card_Category
- Purple ColorCluster consists of customers with low income and medium credit limit -- Silver Card_Category
- Blue Color Cluster consists of customers with low income and low credit limit -- Blue Card_Category
Clusters formed with respect to Credit_Limit and Income features as they have more influence.
Input Data for Recommendation: